Volatility can be defined by how much prices fluctuate during a certain period of time. The volatility in the underlying instrument carries a great deal of importance in the pricing of the options.
In the option market, traders care about historical volatility and implied volatility.
Historical Volatility
Historical volatility is the actual price movement which has already been seen in the underlying stock or futures contract. Traders use this information to set some expectation for how much prices may fluctuate in the future.
Implied Volatility
Implied volatility (IV) is a forward-looking expectation of price fluctuation. This expectation of future volatility also helps to determine probability of an underlying security trading at a particular price by a specified time. Implied volatility is derived from an option pricing model and carries great importance in the pricing of options.
A stock or index which fluctuates over a wide price range will have greater volatility. The higher the implied volatility number, the wider the expected range will be for closing prices during the given timeframe, which in turn means higher option premium.
Implied volatility reveals the opinion of the market for the size of the expected move in a stock or index, but does not imply a direction.
For example, an implied volatility of 30% over the next year would suggest that a $10 stock is expected to fluctuate up or down by $3, leaving it below $7 or above $13 by the end of that 12-month period.
These expectations are not at all guarantees, they are simply the collective opinion of the market. There will be times when price fluctuates much less or much more than expected. Changes can occur at anytime in the price action velocity which will in turn change the implied volatility values, so IV is not a stagnant number. IV Rank is also useful for trading.
Options have greater time value when volatility is high, and less time value when volatility is low. In both cases, prices are affected by the degree of expectation for movement, or volatility.
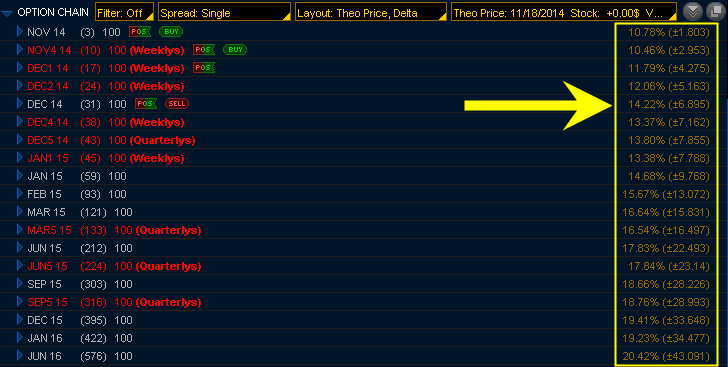
IV can be seen on the option chain for each expiration shown. The percentage number is the IV, and the +/- number in parenthesis is the expected price fluctuation.
Return to the main options glossary page to learn more terms.

